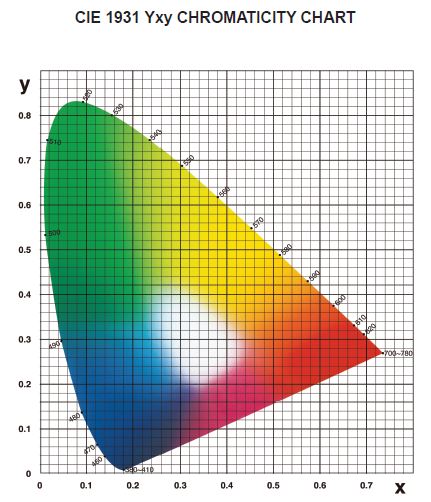
XYZ tristimulus values and the associated Yxy color space form the foundation
of present CIE color spaces. CIE defined a color space in 1931 for graphing color
in two dimensions independent of lightens. In this diagram, achromatic colors
are toward the center of the chart, and the chromaticity increases toward the
edges.
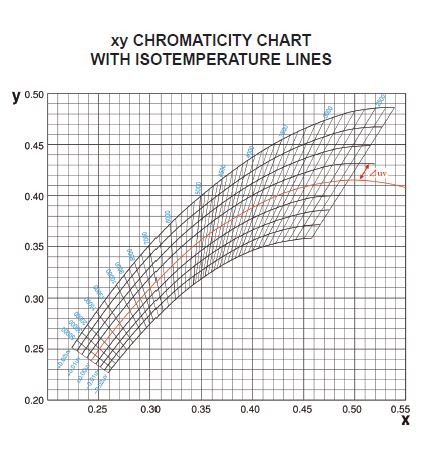
Correlated color temperature is used to apply the general idea of color temperature
to those colors that are close to but not exactly, on the blackbody locus. The
blackbody locus, the isotemperature lines and lines that indicate equal values of
Duv from the blackbody locus are illustrated in the chart.
 Isotemperature Lines on xy Chart
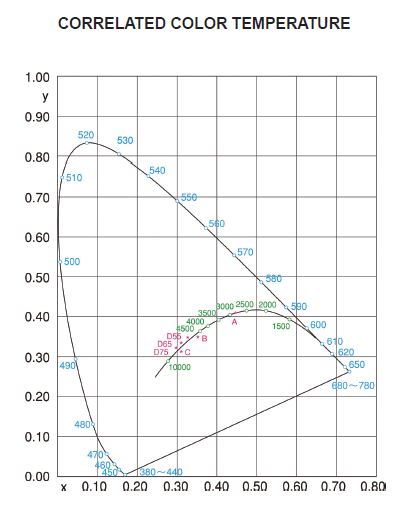
The absolute temperature of the blackbody is referred to as the color temperature.
These colors would lie in the ideal blackbody locus, as indicated in the xy
chromaticity chart.

